Eleven floors below the Prime Minister's office, sits a windowless concrete ring built for one purpose: running the country through its worst days. Officially the National Crisis Management Centre (NCMC), it's known almost universally by its nickname, the Beehive Bunker. From here, agencies from across central government coordinate New Zealand's response to whatever the country throws at it: earthquakes, cyclones, floods, volcanic eruptions, and the occasional pandemic. It has been part of the Beehive since before the rest of the building existed above it.
🛡️
LIVE NATIONAL STATUS
National Resilience Monitor
Weather, seismic, volcanic, fuel and infrastructure status across New Zealand
Weather
loading…
Seismic
loading…
Volcanic
loading…
Fuel Supply
loading…
Electricity Grid
loading…
Internet
loading…
Last refresh: —
National Crisis Management Centre - The Real Beehive Bunker
1972
Opened
First part of the Beehive site completed, years before the tower above it
~5m
Below Ground
Sub-basement level, beneath the ministerial floors
Mercalli X
Seismic Rating
Engineered to withstand "Intense" shaking
100
Cafeteria Capacity
Meals it can serve during a full activation
120
Current Capacity
Staff the existing facility can realistically house
350
Alpine Fault Need
Estimated staff required for a major Alpine Fault earthquake
History & Origins
◆ From Cold War Construction to Today
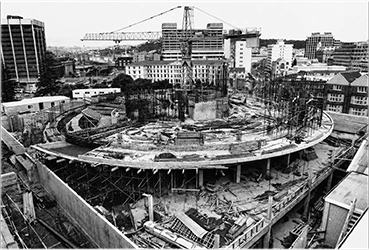
Construction on the Beehive began in 1969, but the basement crisis centre was actually the first part of the building finished, completed and operational by July 1972, a full five years before Queen Elizabeth II opened the rest of the building above it. The brutalist, windowless ring was poured at a time when Cold War-era civil defence thinking still shaped government planning, and the result is a facility designed to function in near-total isolation from the city above it: no windows, a single hardened entrance, and a layout built to keep working long after whatever happens on the surface.
Despite the dramatic nickname, the door into the bunker is almost mundane, a plain, labelled doorway in the Beehive's basement that gives little hint of what lies beyond. Past it, a sign and a further stairwell lead down into the facility itself, sealed off behind a reinforced, bank-vault-style door with a rack of emergency axes and hammers mounted nearby for forced egress if ever needed. It's this contrast between an unglamorous entrance and serious underlying engineering that captures the NCMC best: more functional government office than Hollywood film set, but built to genuinely keep working when everything else around it stops.
Where It Sits — Layout & Access
How It Works — The CIMS Model
◆ Coordinated Incident Management System
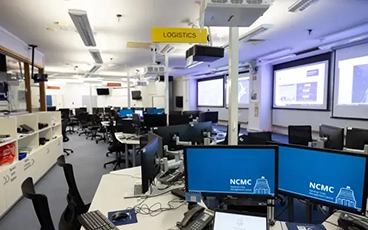
Activity inside the NCMC runs on the Coordinated Incident Management System (CIMS), New Zealand's standard framework for managing an emergency response across multiple agencies at once. Rather than one organisation taking charge of everything, CIMS splits the work into clearly defined functions, each staffed by specialists who understand that role regardless of which agency they're drawn from.
Operations
⟷
Planning
⟷
Logistics
⟷
Welfare
⟷
Intelligence
⟷
Public Information
⟷
Iwi Liaison
During a major event, the centre can be staffed by well over a hundred people pulled from across central government, Police, Customs, MBIE, MPI, Inland Revenue, MSD, Te Puni Kōkiri, the Ministry for the Environment, the Ministry of Education, the Ministry of Housing and Urban Development, and the Defence Force have all supplied trained staff in past activations, alongside core NEMA personnel. New Zealand's civil defence model is deliberately devolved rather than centrally commanding: the 16 regional Civil Defence Emergency Management (CDEM) Groups retain the local knowledge of their own hazards and communities, while the NCMC's job is to support them with coordination, information, mapping and resourcing, not to dictate the response from Wellington. The centre also doubles as NEMA's National Coordination Centre (NCC), a role it performs far more often than its national-emergency reputation suggests, regularly supporting local CDEM groups through smaller events long before any national emergency is ever declared.
A Tour of the Bunker
◆ Inside the National Crisis Management Centre
Built-In Redundancy
◆ Designed to Survive the Worst
| Feature | Purpose |
|---|---|
| Seismic engineering | Reinforced concrete structure rated to withstand "Intense" (X) Modified Mercalli shaking |
| Independent power | Backup generation to keep the centre running through a wider grid outage |
| Independent water & food | Stored emergency supplies to sustain staff without outside resupply |
| Independent telecommunications | A dedicated comms system plus backup links, separate from the public network |
| Independent air filtration | Self-contained air conditioning and filtering system, separate from the rest of the building |
| Security systems | Controlled, hardened access — including the bank-vault-style entry door |
| Alternative NCMC (Auckland) | Geographic backup site, established after the Kaikōura earthquake, for use if Wellington's facility is inaccessible or government has relocated |
The Auckland alternative exists because a sufficiently large Wellington earthquake could simultaneously damage the Beehive and cut off access to it, the one scenario the Wellington centre, however well-engineered, can't fully insure itself against. It's designed to activate if the Wellington facility or its staff can't function, during very large or multi-location events, or if central government itself has had to relocate to Auckland. Staff from a range of agencies, including Police, Corrections, MBIE, MPI, Inland Revenue, MSD, Customs and others, train periodically for activating the Auckland site.
Learn more: National Emergency Management Agency – civildefence.govt.nz ↗ · National Crisis Management Centre — Wikipedia ↗
Strain, Scrutiny & The Next Bunker
Timeline of Activations
New Zealand's weather is famously changeable, a single day can swing from bright sunshine to driving rain and back again, regardless of the season. Two main islands stretched across more than 13 degrees of latitude, combined with mountain ranges and surrounding oceans, mean conditions vary enormously from region to region at any given time. This variability also brings genuine hazards: ex-tropical cyclones, severe thunderstorms, heavy rain and flooding, snow, and strong winds can all occur with little warning, making it worth checking active warnings before heading out or making plans.
◆ Active Weather Warnings — New Zealand
LIVE
0
Yellow Watches
Plan and Prepare
0
Orange Warnings
Take Action
0
Red Warnings
Act Immediately
🟡 Yellow Watches: Plan and Prepare
- What it means: Issued up to 3 days in advance to signal that severe weather is possible but exact details are still uncertain.
- Impact: There is no immediate threat, but conditions may escalate.
- Action: Use this as a "heads-up" to check forecasts frequently, plan appropriately, and stay alert.
🟠 Orange Warnings: Take Action
- What it means: Severe weather is imminent or is already occurring. The event meets MetService's specific criteria (e.g., heavy rain thresholds, gale-force winds).
- Impact: Expect significant disruption to your day, with potential risks to people, animals, and property (e.g., power outages, flooding, road closures).
- Action: Act now to prepare. Secure loose outdoor items, avoid non-essential travel, and follow local authority guidance.
🔴 Red Warnings: Act Immediately / Threat to Life
- What it means: Reserved for New Zealand's most extreme, rare, and destructive weather events.
- Impact: Widespread damage, considerable risk to life, and severe disruption to entire communities.
- Action: Immediate action to protect life and property is required. Stay indoors, seek sturdy shelter away from trees and hazards, avoid all travel, and strictly follow Civil Defence instructions.
⟳ Loading weather alerts…
—
Total Quakes (Last 7 days)
Past 7 days, all magnitudes
—
Felt Quakes (Last 7 days)
Reported felt by public
—
M4.0+ Quakes (Last 7 days)
Potentially damaging
—
Largest Quake (Last 7 days)
Loading…
Magnitude Breakdown — Last 7 Days
—
M 2.0 – 2.9
—
M 3.0 – 3.9
—
M 4.0 – 4.9
—
M 5.0+
◆ Earthquake Map — 7 Days LIVE
Circles scaled to magnitude. Click for details. Data: GeoNet CC-BY.
◆ About New Zealand Seismicity
New Zealand sits on the boundary of the Pacific and Australian tectonic plates, one of the most seismically active zones on Earth. The country experiences around 14,000–15,000 earthquakes per year, of which roughly 100–150 are felt by people. The Alpine Fault, running 600 km along the South Island, is considered overdue for a magnitude 8+ rupture. Other major fault systems include the Hikurangi subduction zone (east of the North Island), the Wellington Fault, and the Wairau Fault.
A major Alpine Fault earthquake could cause widespread infrastructure damage across the South Island, with potential isolation of communities for weeks to months. NEMA's "AF8" scenario planning estimates up to 80% of South Island road bridges could be damaged. Full earthquake history is available at GeoNet.org.nz.
—
Normal Activity
Level 0–1
—
Advisory / Warning
Level 2+ volcanoes
—
Elevated Activity
Level 3+
7
LIVE
Monitored Volcanoes
Volcanic Alert Levels — All Major Centres
⟳ Loading volcanic alert levels from GeoNet…
◆ Volcanic Alert Level (VAL) Scale
| Level | Aviation Colour | Description | Typical Behaviour |
|---|---|---|---|
| 0 | ■ GREEN | No volcanic unrest | Typical background quiet state |
| 1 | ■ YELLOW | Minor volcanic unrest | Increased activity; no eruption threat |
| 2 | ■ YELLOW | Moderate volcanic unrest | Significant activity; small eruptions possible |
| 3 | ■ ORANGE | Minor volcanic eruption | Steam/gas/small eruptions; volcanic hazards near vent |
| 4 | ■ ORANGE | Moderate volcanic eruption | Eruption with significant impact potential |
| 5 | ■ RED | Major volcanic eruption | Significant eruption posing risk to life and property |
Source: GeoNet Volcanic Alert Levels · geonet.org.nz/volcano · Data is CC-BY GeoNet/GNS Science.
Current Fuel Stocks — Days of Cover
◆ National Fuel Stock — Real-Time Estimate
LIVE
⟳ Loading fuel stock data from FuelClock.nz…
Incoming Fuel Tankers
| Vessel | Fuel | Cargo (days) | Status | ETA (NZT) | Origin | Destination |
|---|---|---|---|---|---|---|
| ⟳ Loading vessel data… | ||||||
In-country = fuel estimated to be in NZ storage tanks, depleted forward in real time from the MBIE anchor date using day-of-week consumption weighting. Confirmed vessels = AIS-verified cargo en route or at berth (not yet discharged into tanks). Total (incl. confirmed) = in-country + confirmed vessels only, likely/scheduled supply is excluded. MSO = Minimum Stock Obligation (legal minimum, measured against in-country stock): Petrol 28d, Diesel 21d, Jet Fuel 24d.
Data: FuelClock.nz ↗ · anchored to MBIE Fuel Stock & Shipping Updates ↗ · Vessel data via AIS. Updated every 2 minutes.
Retail Fuel Prices (National Weekly Average)
◆ Current Retail Prices
LIVE
Regular Petrol 91
$2.459
NZD / litre (national avg)
▲ +2.1¢ from last week
Premium Petrol 95
$2.639
NZD / litre (national avg)
— no change
Diesel
$1.749
NZD / litre (national avg)
▼ −3.4¢ from last week
$78.40
Dubai Crude (USD/bbl)
International benchmark
$131.20
Dubai Crude (NZD/bbl)
After FX conversion
28.4¢
Importer Margin / L
MBIE estimated margin
⚠ Strategic fuel reserves: see the days-of-cover snapshot above for current stock levels.
Weekly fuel prices: MBIE Fuel Price Monitoring
Retail Petrol Price Trend (12 weeks)
Source: MBIE Weekly Fuel Price Monitoring (CC-BY 4.0 NZ)
Price Component Breakdown
Approximate breakdown for 91 octane regular petrol
Electricity Generation
◆ Generation Quantities (MWh)
—
LIVE
Generation type
Data: em6.co.nz ↗ free Generation Quantities API (no authorisation required). Figures shown are MWh by generation type; the region filter requests a different grid zone from the same API, if every region returns identical nationwide totals, the API's free tier may currently only expose national-level data.
Generation Fleet & Grid Notices
◆ Transpower Grid Notices — Live Feed
LIVE
Loading live notices…
CAN
—
Customer Advice Notice
Issued when residual generation forecast drops below 200 MW. Can be issued from one week to one hour out. Earliest warning level, take note, no action yet required.
WRN
—
Warning Notice
Issued when residual generation forecast falls below zero, meaning more power demanded than can be supplied. Demand reduction may be requested from large industrial consumers.
GEN
—
Grid Emergency Notice
Issued when a generation deficit is confirmed less than one hour out. May require controlled load shedding (rolling blackouts) by lines companies.
Current Month Notices
Loading…
◆ NZ Electricity Generators — Major Plants by Type
| Station | Type | Region | Capacity (MW) | Operator | Notes |
|---|---|---|---|---|---|
| Lake Manapōuri | Hydro | Southland | 840 | Meridian Energy | Feeds Manapouri power station; NZ's largest single generator, supplies Tiwai smelter |
| Lake Benmore | Hydro | Waitaki Valley | 540 | Meridian Energy | Feeds Benmore power station; largest earth-fill dam in NZ |
| Lake Dunstan | Hydro | Central Otago | 432 | Contact Energy | Feeds Clyde power station |
| Lake Pūkaki | Hydro | Mackenzie Basin | 264 | Meridian Energy | Pūkaki Canal joins Lake Ōhau's flow at Ōhau A power station |
| Lake Ōhau | Hydro | Mackenzie Basin | 212 | Meridian Energy | Ōhau Canal joins Lake Pūkaki's flow at Ōhau A; cascades downstream to Ōhau B & C power stations |
| Lake Tekapo | Hydro | Mackenzie Basin | 160 | Genesis Energy | Feeds Tekapo A & B power stations |
| Lake Waitaki | Hydro | Waitaki Valley | 105 | Meridian Energy | Feeds Waitaki power station; lowest station in the Waitaki hydro chain |
| Te Mihi | Geothermal | Waikato | 166 | Contact Energy | Wairakei geothermal field |
| Nga Awa Purua | Geothermal | Bay of Plenty | 140 | Mighty River (Mercury) | Single largest geothermal unit globally |
| Huntly | Thermal (Gas/Coal) | Waikato | 400 | Genesis Energy | Peaker / dry-year backup; coal use reducing |
| Pohokura | Gas-fired | Taranaki | 107 | Contact Energy | Taranaki Combined Cycle plant |
| Te Uku | Wind | Waikato | 64 | Mercury Energy | 23 turbines on Raglan coast ridge |
| West Wind | Wind | Wellington | 143 | Meridian Energy | Largest wind farm in NZ; Mākara |
| Mill Creek | Wind | Wellington | 60 | Meridian Energy | Ohariu Valley, north Wellington |
| Kaiwera Downs | Wind | Southland | 132 | Mercury | Opened 2023; 44 turbines |
NZ generates approximately 80–85% of electricity from renewable sources (hydro, geothermal, wind). During dry years, hydro lake levels drop and thermal (gas/coal) generation at Huntly increases to compensate. Total NZ installed capacity ~10,000 MW. Source: Electricity Authority, company reports.
Hydro Lake Levels — Meridian Energy
◆ South Island Hydro Storage
meridianenergy.co.nz/lake-levels ↗
8
Lakes Monitored
~4,000 MW
Total Hydro Capacity
2
Hydro Schemes
Weekly
Graph Update Frequency
📊 Lake level graphs are embedded directly from Meridian Energy's public website and update approximately weekly. Two confirmed graph URLs are embedded live; the remaining six need their Meridian GraphFile URLs added, see the placeholder cards below. Full archive and interactive charts at meridianenergy.co.nz/lake-levels ↗
Manapōuri & Waitaki Hydroelectric Schemes
Lake Pūkaki
Waitaki scheme · storage lake
Feeds: Ohau A (264 MW), Ohau B (212 MW), Ohau C (212 MW), Mackenzie Basin
Lake Ruataniwha
Waitaki scheme · regulation lake
Feeds: Regulation lake between Pūkaki and Ohau A, manages flow for Ohau canal system
Lake Ōhau
Waitaki scheme · storage lake
Feeds: Ōhau A (264 MW), Ōhau B (212 MW), Ōhau C (212 MW), South Canterbury
Lake Benmore
Waitaki scheme · largest reservoir
Feeds: Benmore power station (540 MW), NZ's largest earth-fill dam
Lake Aviemore
Waitaki scheme · run-of-river
Feeds: Aviemore power station (220 MW), downstream of Benmore
Lake Waitaki
Waitaki scheme · lowest storage
Feeds: Waitaki power station (105 MW), lowest station in the Waitaki chain
Lake Te Anau
Manapōuri scheme · upper storage
Feeds: Flows south via Waiau River to Lake Manapōuri, NZ's second-largest lake
Lake Manapōuri
Manapōuri scheme · main reservoir
Feeds: Manapōuri power station (840 MW), NZ's largest generator; primarily supplies Tiwai Point aluminium smelter
Graph images update approximately weekly from Meridian Energy. Two URLs confirmed (Pūkaki GraphFile/633, Ōhau GraphFile/634), paste the remaining Meridian GraphFile URLs into the HTML comments in each placeholder card. Click any graph image or placeholder to view full size.
Future Capabilities
◆ Federated Outage Map — Pilot Project
Project: Federated Electricity Outage Map, Pilot Project
Lead: Digital Built Aotearoa Foundation
Funding: National Emergency Management Agency (NEMA)
Goal: Combine real-time outage data from all electricity distribution businesses (EDBs) into a single public map, equivalent to a 111 for power outages.
Status: Pilot under development as of 2025. No public URL yet. When available, data will be linked here.
Lead: Digital Built Aotearoa Foundation
Funding: National Emergency Management Agency (NEMA)
Goal: Combine real-time outage data from all electricity distribution businesses (EDBs) into a single public map, equivalent to a 111 for power outages.
Status: Pilot under development as of 2025. No public URL yet. When available, data will be linked here.
Currently, each of New Zealand's ~28 electricity distribution businesses (Vector, Powerco, Aurora, Orion, etc.) publishes outage data separately, often in incompatible formats. The Federated Outage Map project aims to aggregate these into a unified real-time feed accessible to the public and emergency management agencies.
ℹ️ This section is static informational content updated quarterly from Stats NZ and MBIE trade data. Last updated: June 2025. Source: Stats NZ Overseas Merchandise Trade.
Import Reliance by Food Category
Rice
~100%
NZ grows no commercial rice. Entirely imported, primarily from Australia, Thailand, and the US.
Wheat & Flour
~90%
Small domestic wheat crop (Canterbury). Most flour, bread flour, and pasta wheat is imported from Australia.
Canned & Processed Foods
~85%
Canned vegetables, soups, packaged goods largely imported. Domestic canning industry very small.
Sugar & Confectionery
~100%
No domestic sugar production. All raw and refined sugar imported from Australia, Fiji, and the Philippines.
Cooking Oils
~95%
Palm oil, canola oil, sunflower oil largely imported. Limited domestic seed oil production.
Fruit & Vegetables (fresh)
~35%
Off-season imports significant. NZ exports kiwifruit, apples; imports bananas, tropical fruit, some vegetables in winter.
Meat (beef, lamb)
~5%
NZ is a major meat exporter. Domestic meat supply is robust. Some specialty cuts imported.
Dairy Products
~5%
NZ is the world's largest dairy exporter per capita. Domestic supply is more than sufficient.
Seafood
~15%
Some species and processed seafood imported. NZ EEZ is extensive; domestic harvest significant.
◆ Resilience Assessment
| Scenario | Risk Level | Key Vulnerability | Estimated Domestic Supply |
|---|---|---|---|
| 14-day supply disruption (e.g., major shipping stoppage) | MODERATE | Rice, flour, cooking oils, sugar exhausted within weeks | Meat, dairy, vegetables adequate |
| 3-month supply disruption (e.g., global shipping crisis) | SEVERE | Broad grocery shortages; rationing likely for staple carbohydrates | Protein and dairy self-sufficient; caloric gap without wheat/rice |
| 1-year isolation (extreme scenario) | EXTREME | Fertiliser import dependency would limit next harvest cycles | NZ could feed itself on protein; carbohydrate production would need to scale dramatically |
◆ Key Facts & Data Sources
New Zealand exports approximately NZ$50 billion in food and agricultural products per year, making it one of the world's most food-productive nations per capita. However, its domestic grocery market is highly import-dependent for processed and shelf-stable foods. The country imports approximately 15–20% of its total food supply by value, concentrated in staple foods and processed goods.
The primary food security risk in NZ is a prolonged disruption to shipping routes, particularly from Asia and Australia. NZ's geographic isolation means that a 14-day shipping delay is typical in any major port disruption, and most grocery distribution centres carry 4–6 weeks of stock in normal conditions.
Fertiliser import dependency is a secondary risk: approximately 90%+ of fertiliser used in NZ is imported (primarily urea from China and Russia, superphosphate from Morocco). A multi-year fertiliser supply disruption would significantly reduce farm production within 2–3 growing seasons.
📊 Data sources: Stats NZ Overseas Merchandise Trade · MPI Situation & Outlook for Primary Industries · MBIE Food & Beverage Sector · Update quarterly from Stats NZ releases.
Find Your Civil Defence Group
◆ Regional Civil Defence Contacts
New Zealand has 16 Civil Defence Emergency Management (CDEM) Groups, aligned with regional councils.
Each group is responsible for coordinating emergency management in their region, covering preparation, response, and recovery.
Find your local CDEM group, address, and contact details:
civildefence.govt.nz, Find Your Civil Defence Group ↗
Each group is responsible for coordinating emergency management in their region, covering preparation, response, and recovery.
Find your local CDEM group, address, and contact details:
civildefence.govt.nz, Find Your Civil Defence Group ↗

| Region | CDEM Group | Emergency Contact | Website |
|---|---|---|---|
| Auckland | Auckland CDEM Group | 0800 22 22 00 | Auckland Emergency Management ↗ |
| Wellington | Wellington CDEM Group | 0800 239 247 | WREMO.nz ↗ |
| Canterbury | Canterbury CDEM Group | 0800 800 169 | CDEM Canterbury ↗ |
| Bay of Plenty | Bay of Plenty CDEM Group | 0800 884 880 | bopcivildefence.govt.nz ↗ |
| Waikato | Waikato CDEM Group | 07 859 0999 | waikatocivildefence.govt.nz ↗ |
| Otago | Otago CDEM Group | 0800 ORC ENV | otagocdem.govt.nz ↗ |
| All 16 CDEM groups listed at civildefence.govt.nz ↗ | |||
Emergency Preparedness Guidance
Emergency Kit
NEMA recommends 3 days minimum of supplies: water (3L/day/person), food, first aid, torch, radio, phone charger, medications, cash, warm clothing, and important documents.
Build your kit ↗
Tsunami
If you're at the coast and feel a long or strong earthquake: don't wait for official warning. Go immediately to high ground or inland. Natural warning = 20 minutes or less before a local tsunami.
Tsunami guidance ↗
Earthquake
Drop, Cover, Hold: get under a sturdy table, cover head and neck, hold on until shaking stops. After: expect aftershocks. Don't use lifts. Check for gas leaks and structural damage before re-entering buildings.
Earthquake guidance ↗
Volcanic Eruption
Follow evacuation orders immediately. Ash fall: stay inside, seal gaps, wear N95 masks if outside. Avoid low-lying areas near active vents (lahar risk). Lahars travel fast and look like concrete.
Volcano guidance ↗
Cyclone & Flooding
Monitor MetService. Move valuables and whiteware above floor level. Know your evacuation route. Never drive through floodwater, 300mm can float a car. Don't camp near rivers when heavy rain is forecast.
Storm guidance ↗
Wildfire
Know your local fire weather. Evacuation orders: leave early, don't wait until you can see flames. If trapped: call 111, stay low, seal gaps in your vehicle, turn on headlights and hazard lights.
Wildfire guidance ↗
Emergency Alerts
NZ's National Emergency Management Agency (NEMA) can broadcast Emergency Mobile Alerts directly to all capable mobile phones in an area without needing to opt in. Ensure your phone is on and not in silent mode.
About Mobile Alerts ↗
Household Plan
Make a plan with your household: two meeting places (near home, away from neighbourhood), out-of-area contact person, pet plan, special needs. Practice at least once a year.
Make a plan ↗
CERT — Civil Defence Emergency Response Teams
◆ Trained Volunteer Response Teams
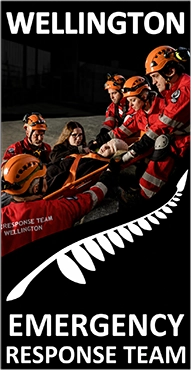
🦺 CERTs are trained volunteers who provide surge support to professional responders during an emergency, assisting with tasks such as search and rescue support, evacuation and welfare assistance, community needs assessment, traffic and cordon control, and post-event damage reconnaissance. In New Zealand, this volunteer capability is formally organised under the name New Zealand Response Teams (NZ-RTs), owned and supported by Territorial Authorities or CDEM Groups around the country. Recruits typically complete NZQA-recognised unit standards covering first aid, the Coordinated Incident Management System (CIMS), and role-specific skills before being deployed, with ongoing training and exercises through the year. These teams have been activated for events including the Canterbury and Kaikōura earthquakes, the 2023 Auckland Anniversary floods, and Cyclone Gabrielle.
These volunteers operate within New Zealand's Civil Defence Emergency Management (CDEM) framework, set out under the Civil Defence Emergency Management Act 2002. The framework is built around the "4Rs", reduction, readiness, response, and recovery, and is delivered through a devolved, three-tier model: NEMA (the National Emergency Management Agency) provides national leadership and coordination on behalf of the Director of Civil Defence Emergency Management; the 16 regional CDEM Groups shown above, made up of city, district, and regional councils working alongside emergency services, lifeline utilities, and iwi, plan for and manage hazards specific to their region; and local authorities and communities carry out day-to-day readiness and the first response on the ground. During an actual response, agencies coordinate using CIMS, New Zealand's standard system for managing an incident across multiple responding organisations. The CDEM Act 2002 is currently being replaced: the Emergency Management Bill (No 2) reported back from select committee on 5 June 2026 and is progressing through Parliament.
Note: "CERT" is also used in New Zealand for the unrelated Computer Emergency Response Team (CERT NZ), the national cyber security incident response service hosted within the National Cyber Security Centre, distinct from civil defence emergency response volunteering.
These volunteers operate within New Zealand's Civil Defence Emergency Management (CDEM) framework, set out under the Civil Defence Emergency Management Act 2002. The framework is built around the "4Rs", reduction, readiness, response, and recovery, and is delivered through a devolved, three-tier model: NEMA (the National Emergency Management Agency) provides national leadership and coordination on behalf of the Director of Civil Defence Emergency Management; the 16 regional CDEM Groups shown above, made up of city, district, and regional councils working alongside emergency services, lifeline utilities, and iwi, plan for and manage hazards specific to their region; and local authorities and communities carry out day-to-day readiness and the first response on the ground. During an actual response, agencies coordinate using CIMS, New Zealand's standard system for managing an incident across multiple responding organisations. The CDEM Act 2002 is currently being replaced: the Emergency Management Bill (No 2) reported back from select committee on 5 June 2026 and is progressing through Parliament.
Note: "CERT" is also used in New Zealand for the unrelated Computer Emergency Response Team (CERT NZ), the national cyber security incident response service hosted within the National Cyber Security Centre, distinct from civil defence emergency response volunteering.
Learn more about NZ Response Teams: civildefence.govt.nz ↗ ·
Volunteer: getready.govt.nz ↗
◆ How NZ Emergency Alerts Work
| System | Who Controls It | How You Receive It | Coverage |
|---|---|---|---|
| Emergency Mobile Alert (EMA) | NEMA | Cell broadcast to all capable phones in an area, no opt-in needed | Cellular coverage area |
| MetService Warnings | MetService NZ | App, website, social media, TV/radio | National, regional, local |
| GeoNet Alerts | GNS Science | Website, app, social media, API | Earthquakes, volcanic, tsunami |
| Public Address System | Local CDEM | Outdoor sirens in coastal/at-risk areas | Local only |
| RNZ National | Radio NZ | AM 101–756 kHz, FM varies by region | National; last resort backup if digital fails |
| Waka Kotahi Traffic | NZTA | Highway signs, journey planner | State highway network |
National Emergency Management Agency (NEMA): nema.govt.nz ·
Get Ready: getready.govt.nz ·
MetService: metservice.com
National Internet & Communications Status
Loading NZ network status…
Major Outages & Incidents
Loading outage data from Cloudflare Radar…
ISP & Network Monitoring
Checking ISP network health…
Sources: Cloudflare Radar · radar.cloudflare.com/nz ↗ ·
ISP health checks (HTTP probes from Cloudflare network)
Note: Data refreshes every 5 minutes. Outages shown are macroscopic events detected by Cloudflare's global network; localised or ISP-specific outages may not appear.
Note: Data refreshes every 5 minutes. Outages shown are macroscopic events detected by Cloudflare's global network; localised or ISP-specific outages may not appear.
Submarine Cable Map & Health
Checking data source…
Operational
Degraded/Fault
Outage
| Cable | RFS | Capacity | Status |
|---|---|---|---|
| Loading cable data… | |||
Sources:
Southern Cross Cable Network ·
Hawaiki Cable ·
TGA (Tasman Global Access) ·
NGA Maritime Safety Information ·
Submarine Cable Map ↗
Disclaimer: Cable data is for reference only and shows approximate routes. Health status sourced from NGA broadcast warnings.